

📈 Current Market Trends - November 24
We track actionable metrics highlighting the current trends of the crypto market and broader economy.

In partnership with

Hi Investor 👋
Welcome to a 🔒 premium edition 🔒 of Altcoin Investing Picks, the most actionable crypto newsletter.
Every Thursday, we send actionable tips to help you build a profitable altcoin portfolio.
If you haven’t yet, subscribe to get access to these posts, and every post.
Just like traditional markets, though, crypto goes through its own cycles – and these price cycles are remarkably consistent, including their timing between peak-to-trough bottoms, price recoveries and subsequent rallies to new cycle highs.
Every month, we track actionable metrics highlighting the current trends of the crypto market and broader economy.
This data is an educational resource to better understand market cycles. While these trends often correlate well with crypto performance, the analysis should not be used as a short term trading strategy.
Let’s dive in!
Macro Trends
M2 & Global Liquidity → 🟢

The global money supply (M2) growth chart shows the money supply growth of the top 21 central banks. If global liquidity is increasing it means that major central banks are making more money available to their country. They do this by reducing interest rates or by purchasing government bonds and other securities to increase the money supply.
GDP Annual Growth Rate (US) → 🟡
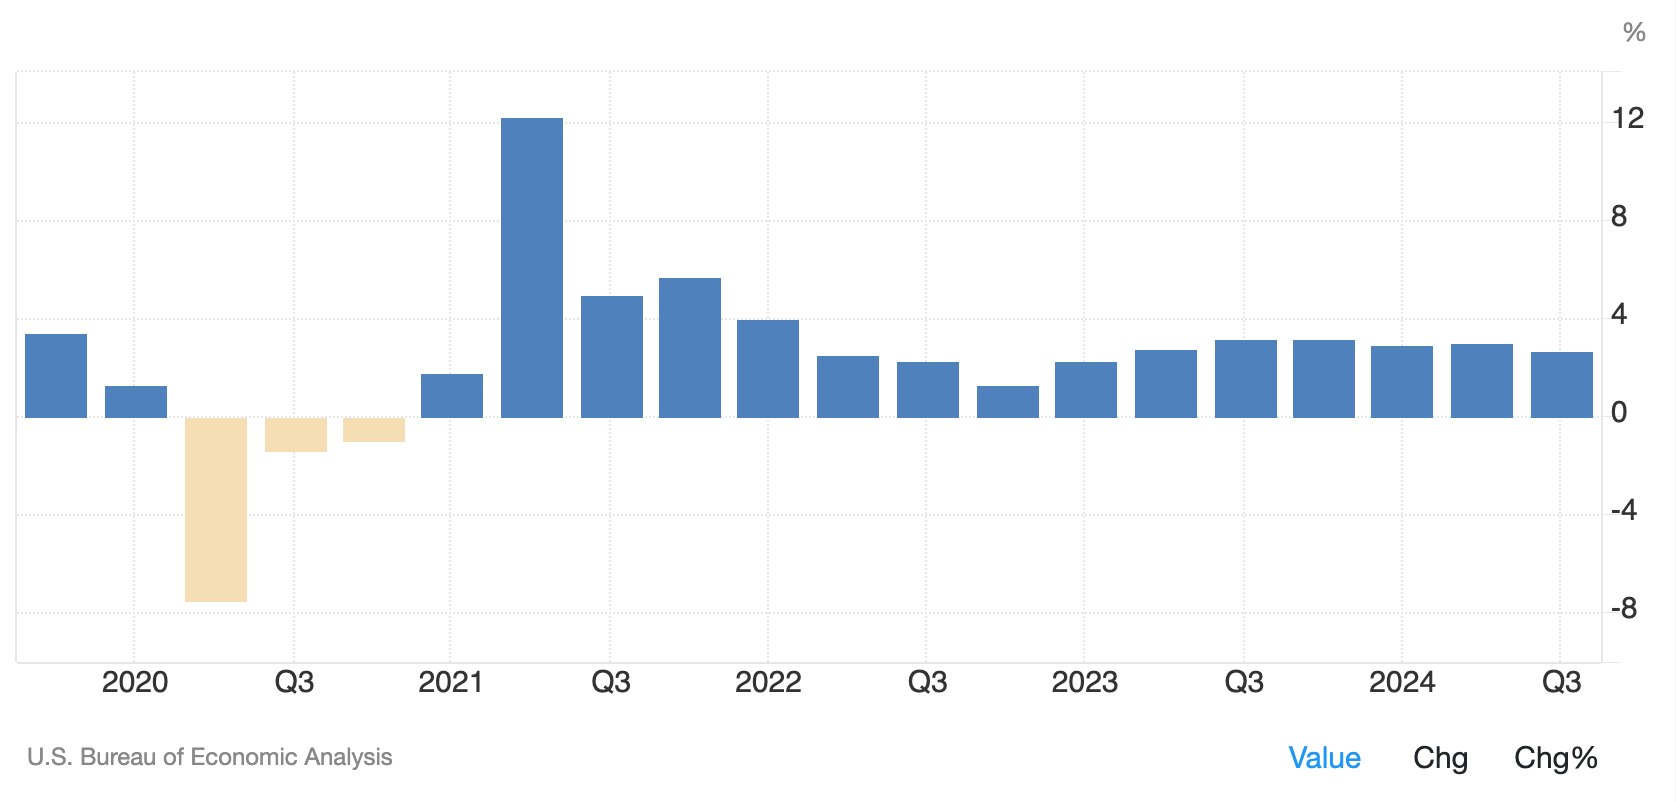
The GDP in the United States expanded 2.7% year-on-year in the third quarter of 2024 , slowing slightly form a 3% rise in the previous period, the advance estimate from the BEA showed. GDP Annual Growth Rate in the United States averaged 3.16 percent from 1948 until 2024.
Annual Inflation Rate (U.S.) → 🟡

The annual inflation rate in the US accelerated to 2.6% in October 2024, up from 2.4% in September which was the lowest rate since February 2021, and in line with market expectations.
Composite PMI (U.S.) → 🟢

The S&P Global US Composite PMI edged up to 54.1 in October 2024 from 54.0 in September, signaling steady growth in US business activity as the year’s final quarter began. The index is based on data collected from a representative panel of over 800 companies and follows variables such as sales, new orders, employment, inventories and prices. A reading above 50 indicates expansion in business activity while below 50 points to contraction.
Unemployment Rate (U.S.) → 🟢
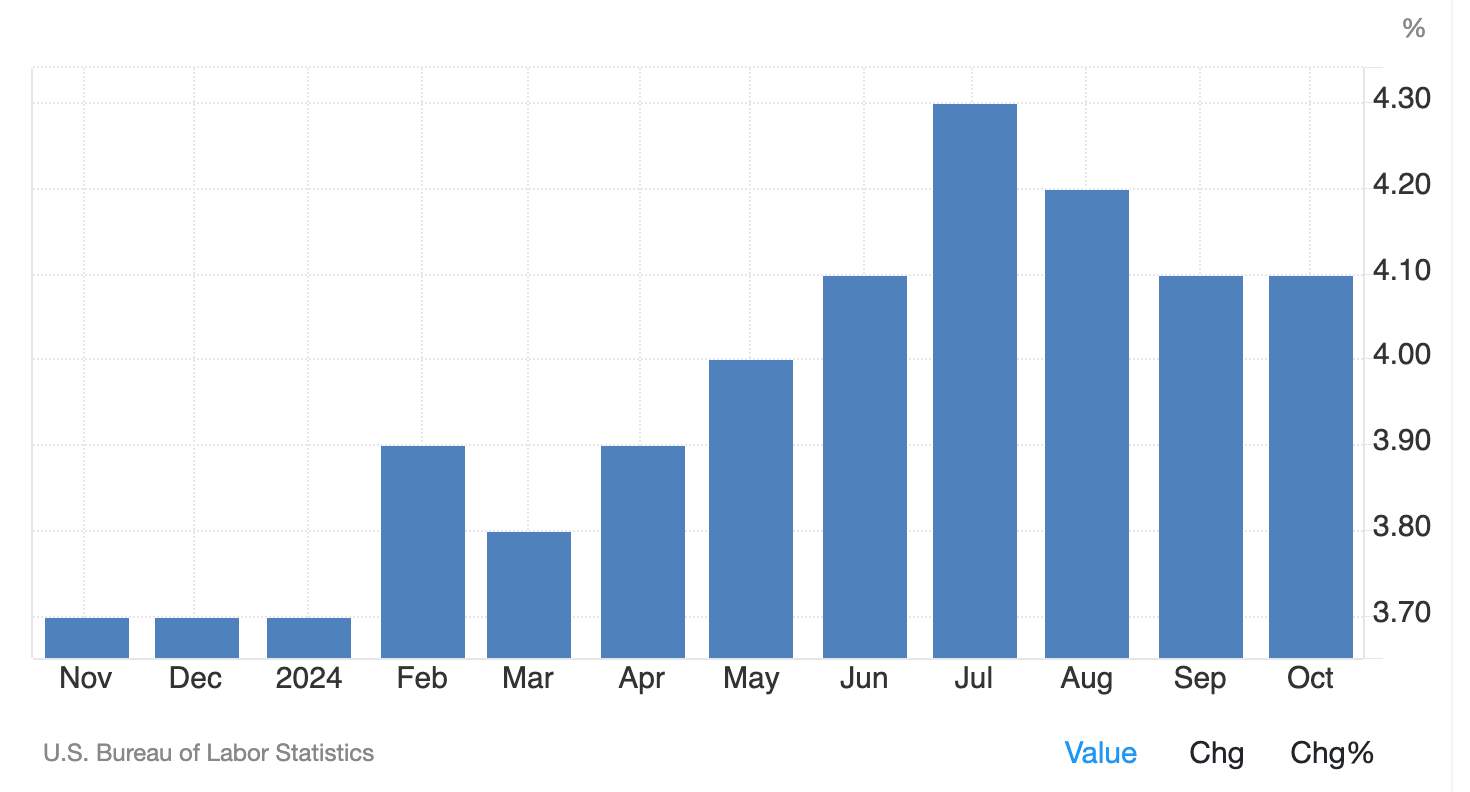
The unemployment rate measures the number of people actively looking for a job as a percentage of the labour force. The unemployment rate in the United States was at 4.1% in October of 2024, remaining unchanged from the three-month low in the prior month, and aligned with market expectations.
In partnership with GoVertical
We buy small online businesses.

Start by filling out their form to see if your business matches what they're looking for.
It takes less than 5 minutes!