

📈 Market Trends - February 24
Actionable metrics highlighting the current trends of the crypto market and broader economy

Hi Investor 👋
welcome to a ✅ free edition ✅ of Altcoin Investing Picks, the most actionable crypto newsletter.
I hope you enjoyed our last issue “How to Find Memecoins Early”
If you haven’t yet, subscribe to get access to this post, and every post.
In today's newsletter we’ll track actionable metrics highlighting the current trends of the crypto market and broader economy.
This data is an educational resource to better understand market cycles. While these trends often correlate well with crypto performance, the analysis should not be used as a short-term trading strategy.
Let’s dive in!
Macro Trends
M2 & Global Liquidity → 🟢

The global money supply (M2) growth chart shows the money supply growth of the top 21 central banks. If global liquidity is increasing it means that major central banks are making more money available to their country. They do this by reducing interest rates or by purchasing government bonds and other securities to increase the money supply.
GDP Annual Growth Rate (US) → 🟡
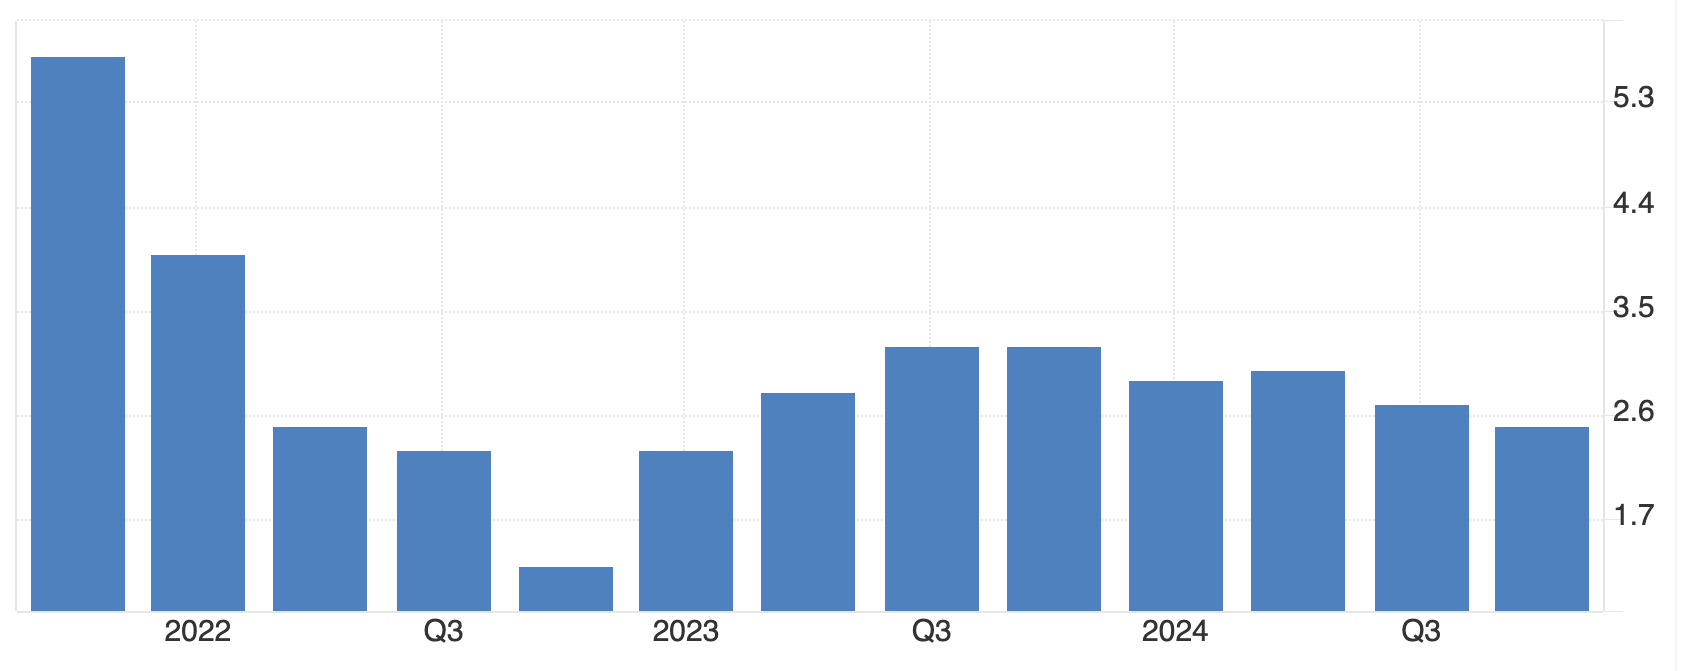
The GDP in the United States expanded 2.5% year-on-year in the fourth quarter of 2024 , slowing slightly form a 2.7% rise in the previous period, the advance estimate from the BEA showed. GDP Annual Growth Rate in the United States averaged 3.16 percent from 1948 until 2024.
Annual Inflation Rate (U.S.) → 🟢
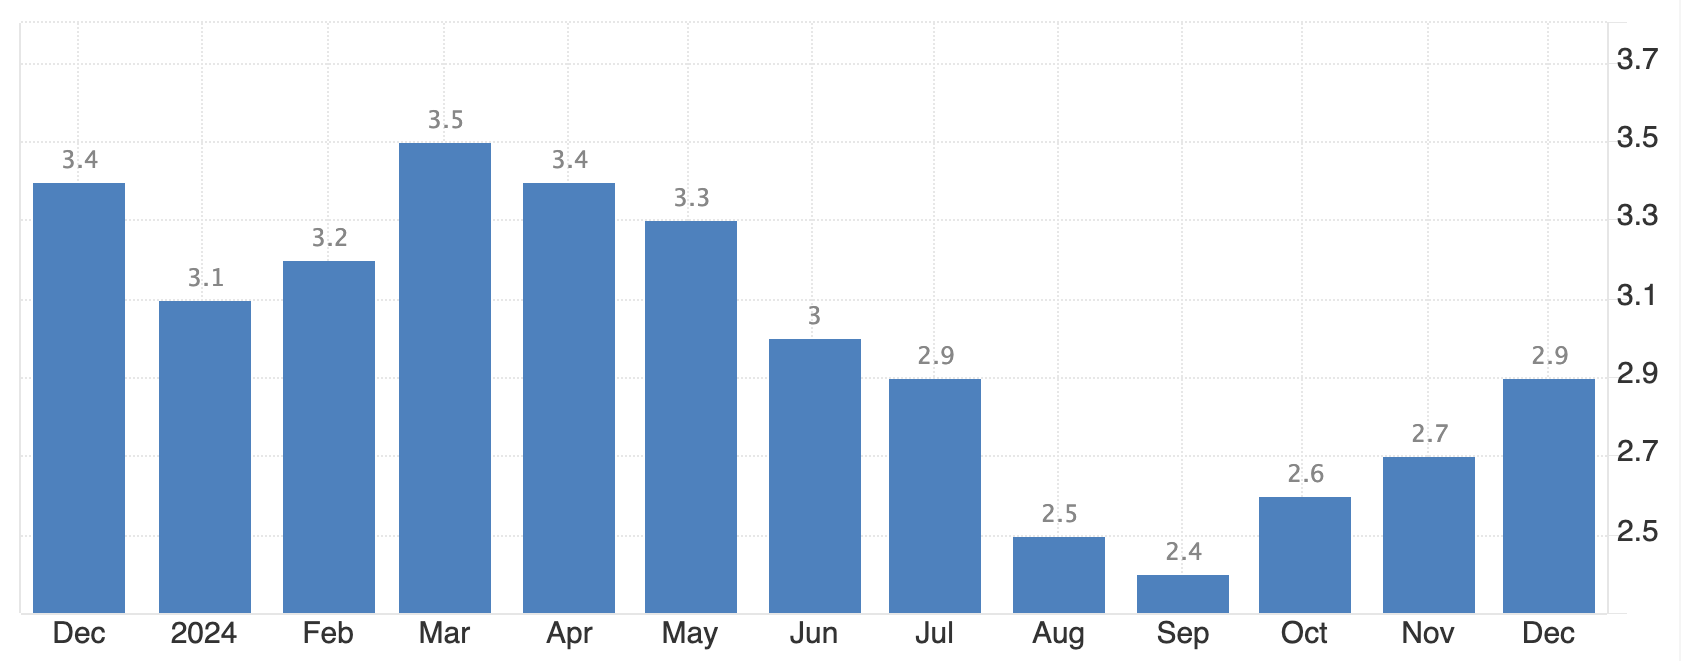
The annual inflation rate in the US rose for a 3rd consecutive month to 2.9% in December 2024 from 2.7% in November, in line with market expectations.
Composite PMI (U.S.) → 🟢

The S&P Global Flash US Composite PMI eased to 52.4 in January 2025, down from December's 55.4, to signal the weakest expansion in the country's private sector in nine months, preliminary estimates showed. Growth in the manufacturing sector (PMI at 50.1 vs 49.4 in December) resumed after six months of contraction, while the service sector (PMI at 52.8 vs 56.8) maintained slower but sustained expansion. Firms' output expectations for the year ahead remained at their highest levels since May 2022, fueled by optimism over the new government's policies, which spurred the steepest hiring rate in two-and-a-half years. However, inflationary pressures reached a four-month high, with input costs and selling prices rising at accelerated rates across both manufacturing and services.
The index is based on data collected from a representative panel of over 800 companies and follows variables such as sales, new orders, employment, inventories and prices. A reading above 50 indicates expansion in business activity while below 50 points to contraction.
Unemployment Rate (U.S.) → 🟡

The unemployment rate in the United States went down to 4.1% in December of 2024 from 4.2% in the previous month, below market expectations of 4.2%. The number of unemployed individuals decreased by 235,000 to 6.886 million, while employment levels increased by 478,000 to 161.661 million.
Take action 🚀
If you want to level up your crypto journey, consider subscribing to the premium package.
Here are some of our latest popular premium posts:
Crypto Trends
Stablecoin Market Cap → 🟢

The supply of stablecoins is a vital indicator of market confidence and functionality. As the crypto market continues to evolve, maintaining a healthy stablecoin supply will be essential for supporting liquidity, fostering innovation, and ensuring overall market stability.
Total Value Locked → 🟢

TVL represents the total value of all assets deposited, staked, or locked into DeFi protocols and smart contracts. Measured typically in U.S. dollars, it provides a clear snapshot of the amount of capital invested in DeFi platforms at any given time.
Active Addresses → 🟢

Active Addresses represents the number of unique blockchain addresses participating in transactions each day or month. Monitoring DAA offers valuable insights into user engagement, network activity, and overall market sentiment.
Bitcoin Dominance → 🔴
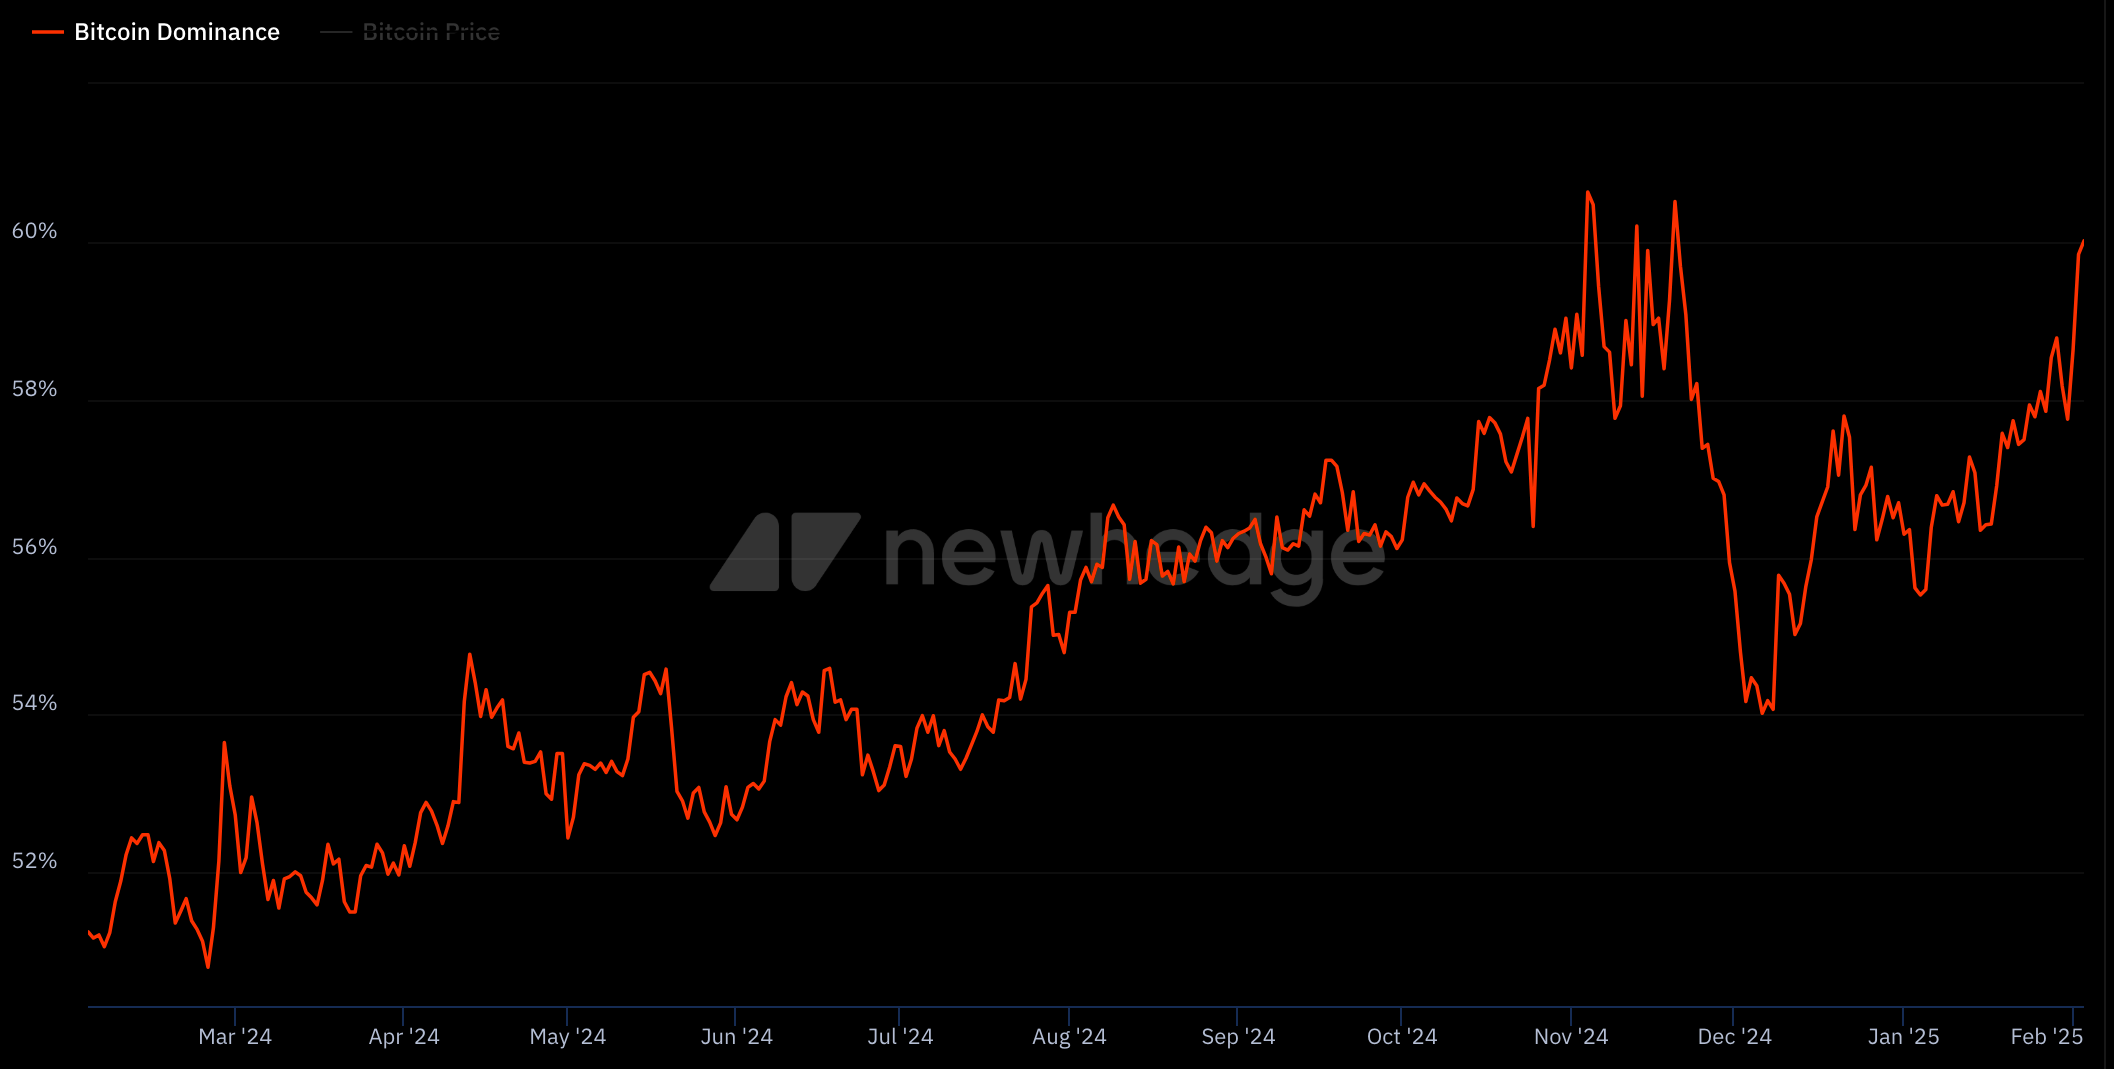
This metric represent the percentage of the total cryptocurrency market capitalization that is attributed to Bitcoin. A high dominance percentage suggests that investors prefer the relative stability of Bitcoin over more volatile altcoins, indicating a risk-averse environment.
BTC dominance is currently at 56.35%. It was closer to 40% when the cycle peaked out.
Transactions → 🟢

Daily Transactions represents the total number of transactions processed by a blockchain network within a 24-hour period. Understanding and monitoring daily transactions provide valuable insights into user engagement, network activity, and overall market dynamics.
Total Funding Rounds → 🟢

Historically VC funding reaches ATH near top of every cycle. According to this data we’re still far from the peak of the bull market, but the trend is growing.

That’s all for today!
Cheers
Take action 🚀
If you want to level up your crypto journey, consider subscribing to the premium package.
Here are some of our latest popular premium posts:
That’s all for today!
Cheers