

5 Fundamental Metrics for Altcoin Trading
PLUS: Get 30% off our premium subscription!

Hi Investor 👋
welcome to a ✅ free edition ✅ of Altcoin Investing Picks, the most actionable crypto newsletter.
I hope you enjoyed our last issue “📈 Market Trends - February 24”
If you haven’t yet, subscribe to get access to this post, and every post.
In today's newsletter:
💡 5 Fundamental Metrics for Altcoin Trading
📣 CoinMarketCap 100 Index
📈 Bitcoin Dominance: 60.57%
Before we dive in
🚨 2025 Offer: Get 30% off our premium subscription!
We’d like to see you make the most of the next bull run, so we’re offering 30% off our yearly subscriptions until Sunday, February 16.
Instead of the usual €139, the annual premium subscription will be €97!!! (30% off) until Sunday, February 16.
With this New Year deal, you can get access to all our picks, articles and analysis for just €8 a month!
Let’s begin!
💡 Insight
5 Fundamental Metrics for Altcoin Trading
When it comes to short-term (weeks to a few months) trading opportunities in the crypto market, knowing which metrics to watch can make all the difference.
Whether you’re flipping altcoins on a short timeline or actively managing a medium- to long-term portfolio, these 10 indicators provide valuable insights into market sentiment, project fundamentals, and network health.
Below are the metrics, categorized by the platforms where you can find them—Artemis, Token Terminal, and DefiLlama—along with tips on how and when to use each.
Daily Active Addresses (Artemis)

Daily Active Addresses (DAA) counts the number of wallet addresses that interact with the network in a given day. High DAA indicates strong user engagement and transaction activity.
How/When to Use It:
Momentum Gauge: Rising DAA often correlates with bullish price action. If DAA is consistently rising over days or weeks, it suggests healthy on-chain activity and potential continued upside.
Exit Strategy: If price is climbing but DAA starts declining, it could signal weakening momentum—an opportune moment to take partial profits.
Ecosystem Flows (Artemis)

Ecosystem Flows track how capital moves in and out of a broader ecosystem (e.g., Layer-1 chains and their associated Layer-2 or dApp projects). This metric aggregates on-chain activity to show where capital is rotating.
How/When to Use It:
Identify Hot Sectors: If you see a surge in capital flowing into a specific ecosystem (like the Avalanche or Arbitrum ecosystem), it may signal the start of a short-term rally.
Rotation Opportunities: When capital flows begin to rotate out of one ecosystem and into another, it could be a cue to exit or rotate your capital to follow the trend.
Protocol Revenue (Token Terminal)

What It Is: Protocol revenue refers to the fees collected by the network or decentralized application (dApp). This could come from trading fees, staking fees, lending fees, or other revenue-generating activities.
How/When to Use It:
Fundamental Strength: Consistently rising revenue often indicates a strong user base willing to pay for the platform’s services. This is a good mid-term bullish signal.
Entry Confirmation: If a token’s price drops but protocol revenue remains stable or grows, it could be a buying opportunity—suggesting the dip might be temporary.
Price-to-Fees (P/F) Ratio (Token Terminal)

What It Is: The Price-to-Fee ratio compares the market cap of a crypto project to its fees. A lower P/F suggests that a token might be undervalued relative to its revenue.
How/When to Use It:
Value Spotting: Use P/F to compare similar projects in the same sector (e.g., DeFi exchanges, Liquid Staking, Layers). If a project has a much lower P/F but similar or better fundamentals, it could be undervalued.
Medium-Term Hold: If you find a token with a low P/F ratio and strong catalysts, it might be worth holding for a few months to capture potential price appreciation.
Market Cap to TVL (DefiLlama)
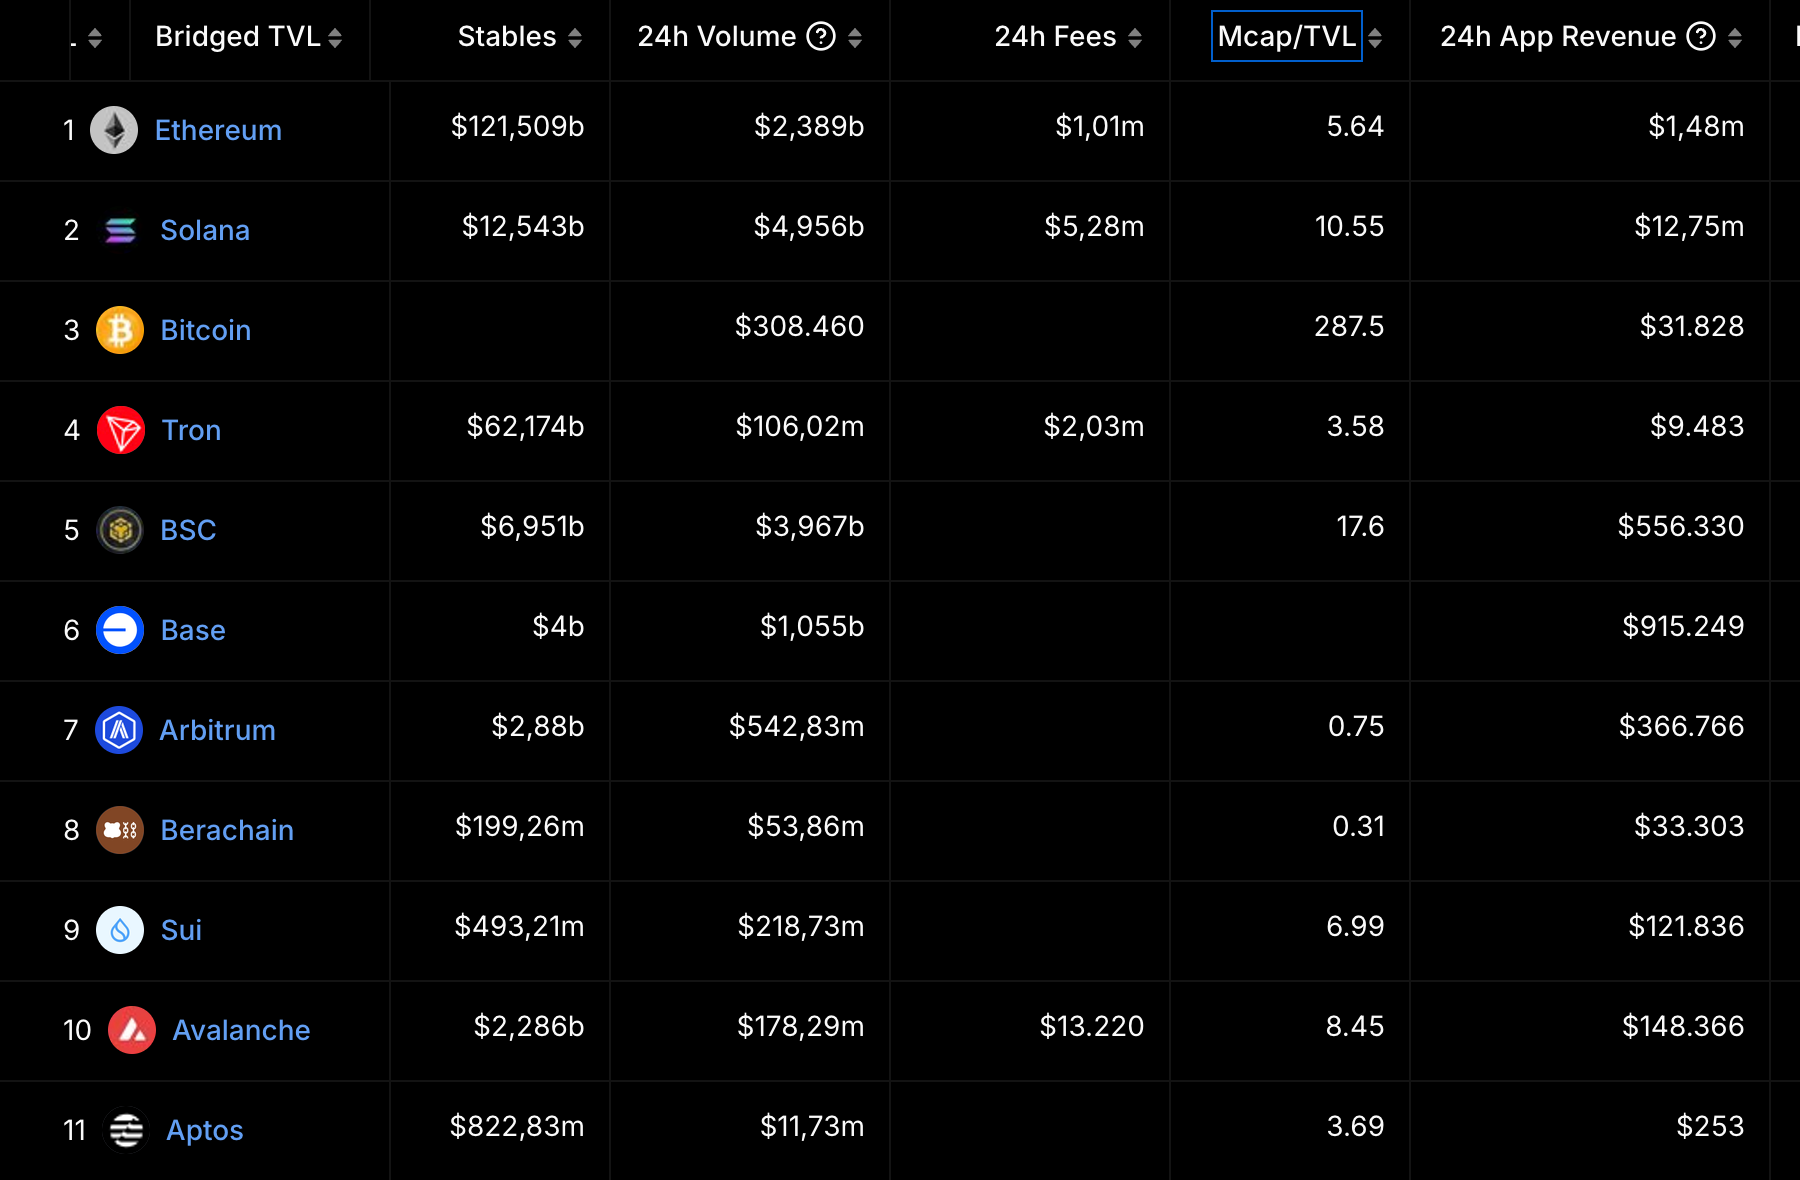
What It Is: The Market Cap to Total Value Locked (MCap/TVL) ratio compares a project’s market capitalization to the value locked in its protocol (particularly for DeFi projects).
How/When to Use It:
Undervalued or Overvalued?: A low MCap/TVL compared to similar projects in the same sector may indicate undervaluation, suggesting room for price growth. A high ratio might signal overvaluation.
Identify Quick Gains: For short-term flips, a sudden decrease in MCap/TVL ratio—due to a spike in TVL—can precede a price run.
📣 Update
CoinMarketCap 100 Index

CoinMarketCap has rolled out a new benchmark for digital assets called the CoinMarketCap 100 Index (CMC100).
The CoinMarketCap 100 Index (CMC100 Index) is a benchmark designed to measure the performance of the top 100 cryptocurrency projects by market capitalization, as ranked by CoinMarketCap. It excludes stablecoins (i.e. USDT) and tokens that are pegged to other crypto assets (i.e. WBTC or stETH). The index represents the broader cryptocurrency market while providing insight into the performance of a diverse set of digital assets.
Why should you care?
The CoinMarketCap 100 Index (CMC100) provides a new unbiased, transparent, and data-driven way to track the performance of crypto markets.
📈 Signal
Bitcoin Dominance: 60.57%
This metric represent the percentage of the total cryptocurrency market capitalization that is attributed to Bitcoin. A high dominance percentage suggests that investors prefer the relative stability of Bitcoin over more volatile altcoins, indicating a risk-averse environment.
BTC dominance is currently at 60.57%. It was closer to 40% when the previous cycles peaked out.
Take action 🚀
If you want to level up your crypto journey, consider subscribing to the premium package.
Here are some of our latest popular premium posts:
That’s all for today!
Cheers